A report is an informational work it provides an analysis of the performance of different marketing channels, these reports are also used to understand more functional information such as seeing which emails are in queue or which segments the contacts associated with. These are extremely valuable as they help in building different reports within Aritic Pinpoint.
All of this information is available under the Report section of the platform. Data is available in two kinds, depending on whether one prefers high-level summary or a granular view of the contact behavior which includes custom fields and values. For example. There are multiple data sources in the report. A channel within the data has two options to offer “Email” and “Email sent”, Emails will contain a high-level view while an email sent will be more granular.
The below instruction gives guidance as to how one can build top three most utilized report.
Emails Sent Report
This report usually gives a granular view of the emails sent. Data from this report provides detailed information about which contacts have received, opened and clicked on different emails. To create this report one must follow the below instructions.
1. To start building reports, select reports option as shown below.
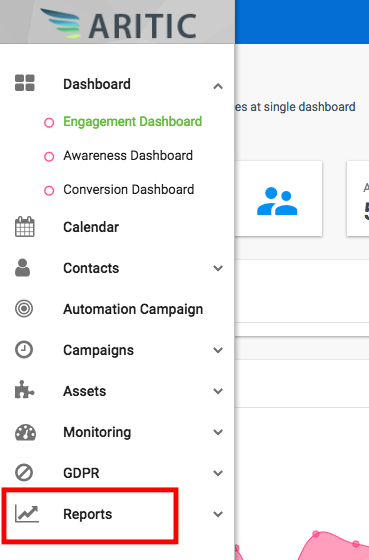
2. Under Reports, you will have three options: Engagement, Social, and Analytics. Select Engagement option.

3. Select New and proceed to name your report.

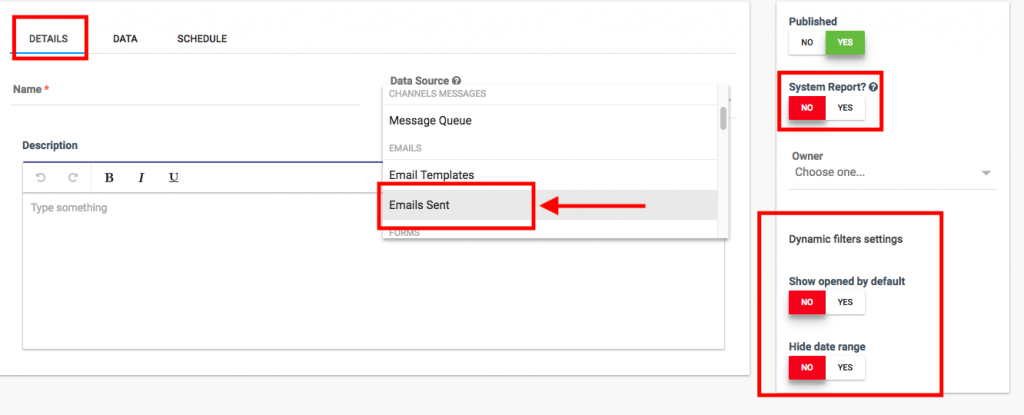
4. Upon clicking on the New option, you will see the following page. Under Details, choose Emails Sent option as shown under data source. Change the Dynamic Filters Settings if deemed appropriate.
[lore_alert_message type=”info”]
You can turn System Report to Yes if you want to restrict the access to your report. If it is set as No, then the owner and those who have permission to access will be able to view others’ reports.
[/lore_alert_message]
5. Select the Data tab to add columns to your report. The most common columns that users add are:
- ID (which is the email ID)
- Name (which is the email name)
- Contact First Name
- Contact Last Name
- Contact email
- Read
- Clicks
- Unique Clicks
- Unsubscribes
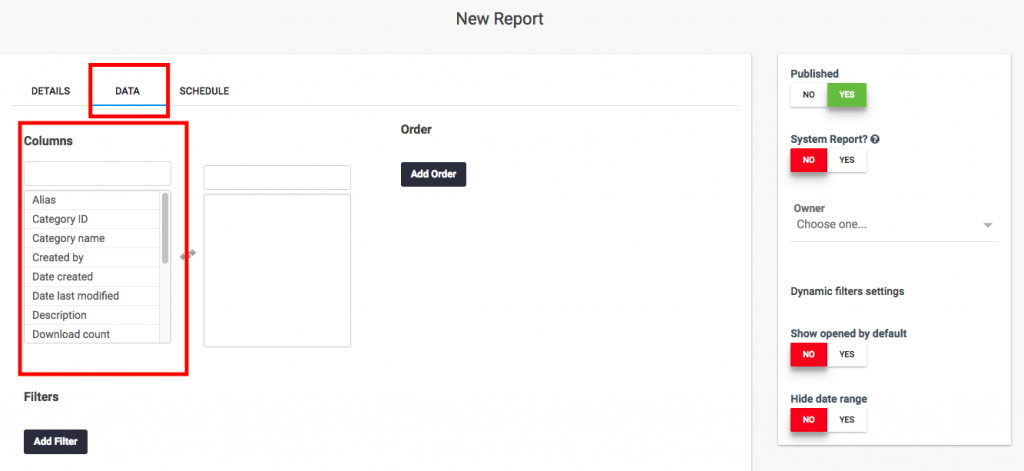
It is recommended that you add a blank filter for the email name or ID by clicking on Add Filter button under the columns. Set the Dynamic option to Yes as this will make it easier to switch easily between the report to review different emails.

6. Save it and then Close from the top right corner of your screen.
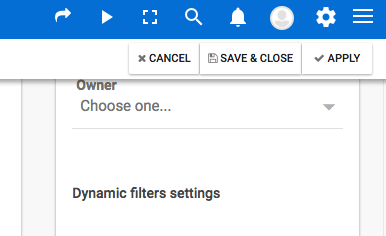
You will now be able to filter the report by exporting the report to CSV, HTML or Excel or expanding the “filters” section in the reports page.
We recommend you use the UI to review your data. However, If you want graphs or pivot tables, then you have to export the report to excel.
To create a similar report,t follow the same instructions above in order to create Form Submissions, Mobile Notifications Sent or Page Hits.
Messages Queued Report
Under this, the report displays a list of all emails lined in which is sent depending on the frequency settings. For assistance with setting up a frequency rule, review the Configuration guide.
The initial steps to get started are same as above. Follow step 1-3.
4. Under Data Source select Message Queued. Proceed to add Columns.
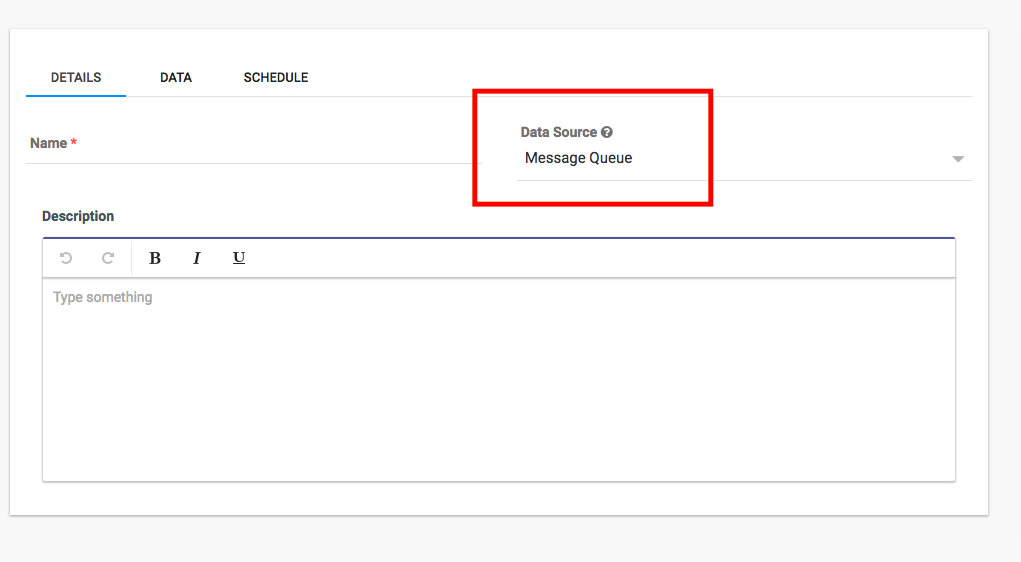
5. Click on Data tab to start creating Columns.
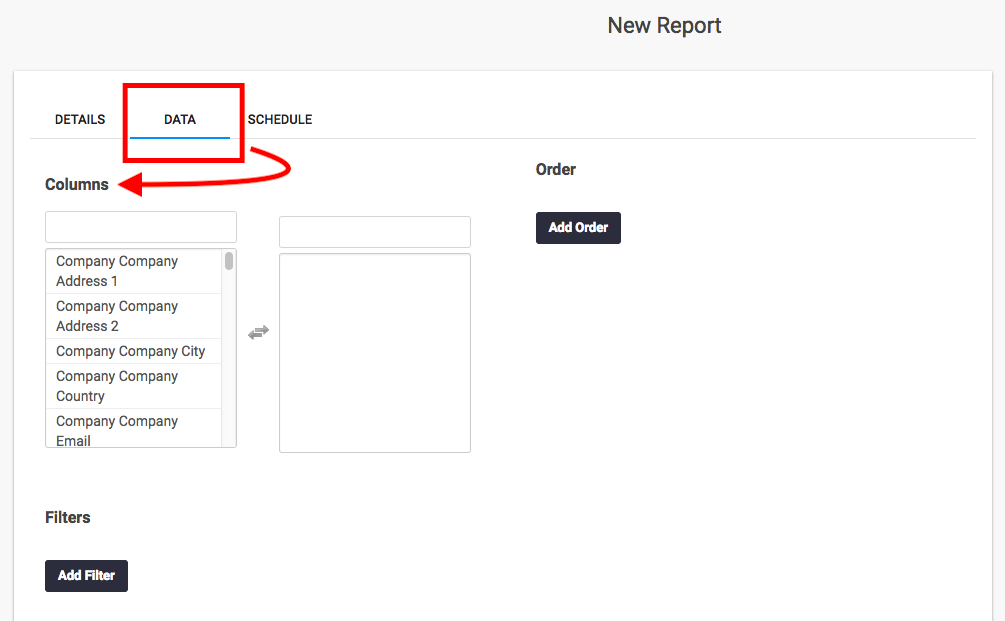
The most popular columns among that users preferably add are:
- Contact email
- Message Channel
- Total Attempts
- Message Channel
- Contact Last Name
- Contact First Name
- Contact ID
- Last Attempt Date
- Message ID
- Scheduled Date
- Success
- Status
6. Choose the appropriate option, then proceed to save and close. You will be redirected to the first screen when you started editing the name of your report. Click on Apply to save your changes and exit.
To view the contact timeline, you will have to go to the contact details which makes the Contact ID clickable. Furthermore, you can filter the report by expanding the “filters” section on the report page, or you can opt to export the report to CSV, HTML or Excel.
Segment Membership Report
This report consists of all the contacts were a part of the segment in the past; it also has information regarding the addition of the same. To create this report, follow the initial steps mentioned in step 1-3 under emails sent report.
4. Select the Data Source as Segment Membership. Click on the Data tab to start adding Columns.
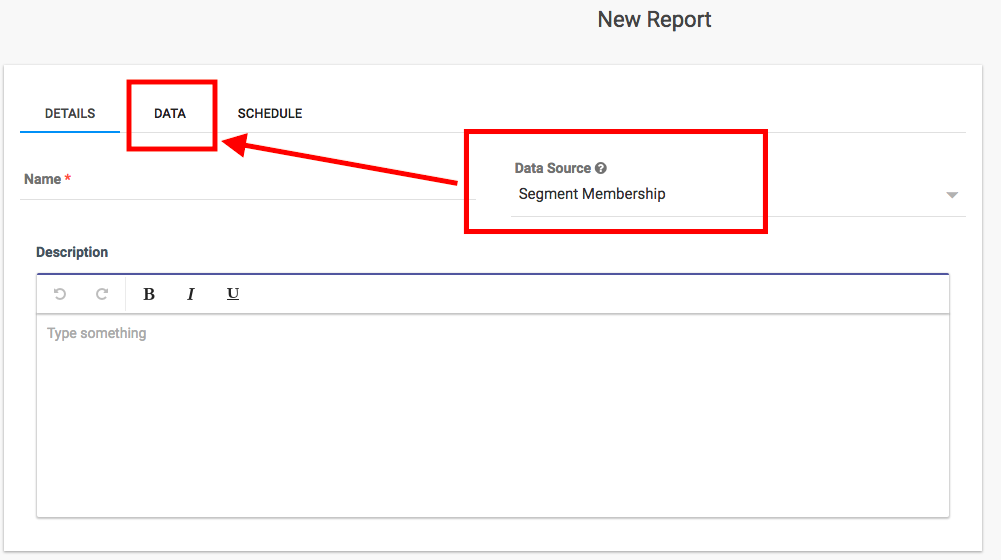
5. Add the appropriate Column from the available list. The most commonly added columns are:
-
- Contact ID
- First Name
- Last Name
- Name (this is supposed to be Name of the segment)
- ID (this is supposed be the ID of the segment)
- Manually Removed
- Manually Added

6. Once done, click on save and close option to return to the main page. Click on apply to save all changes and exit.